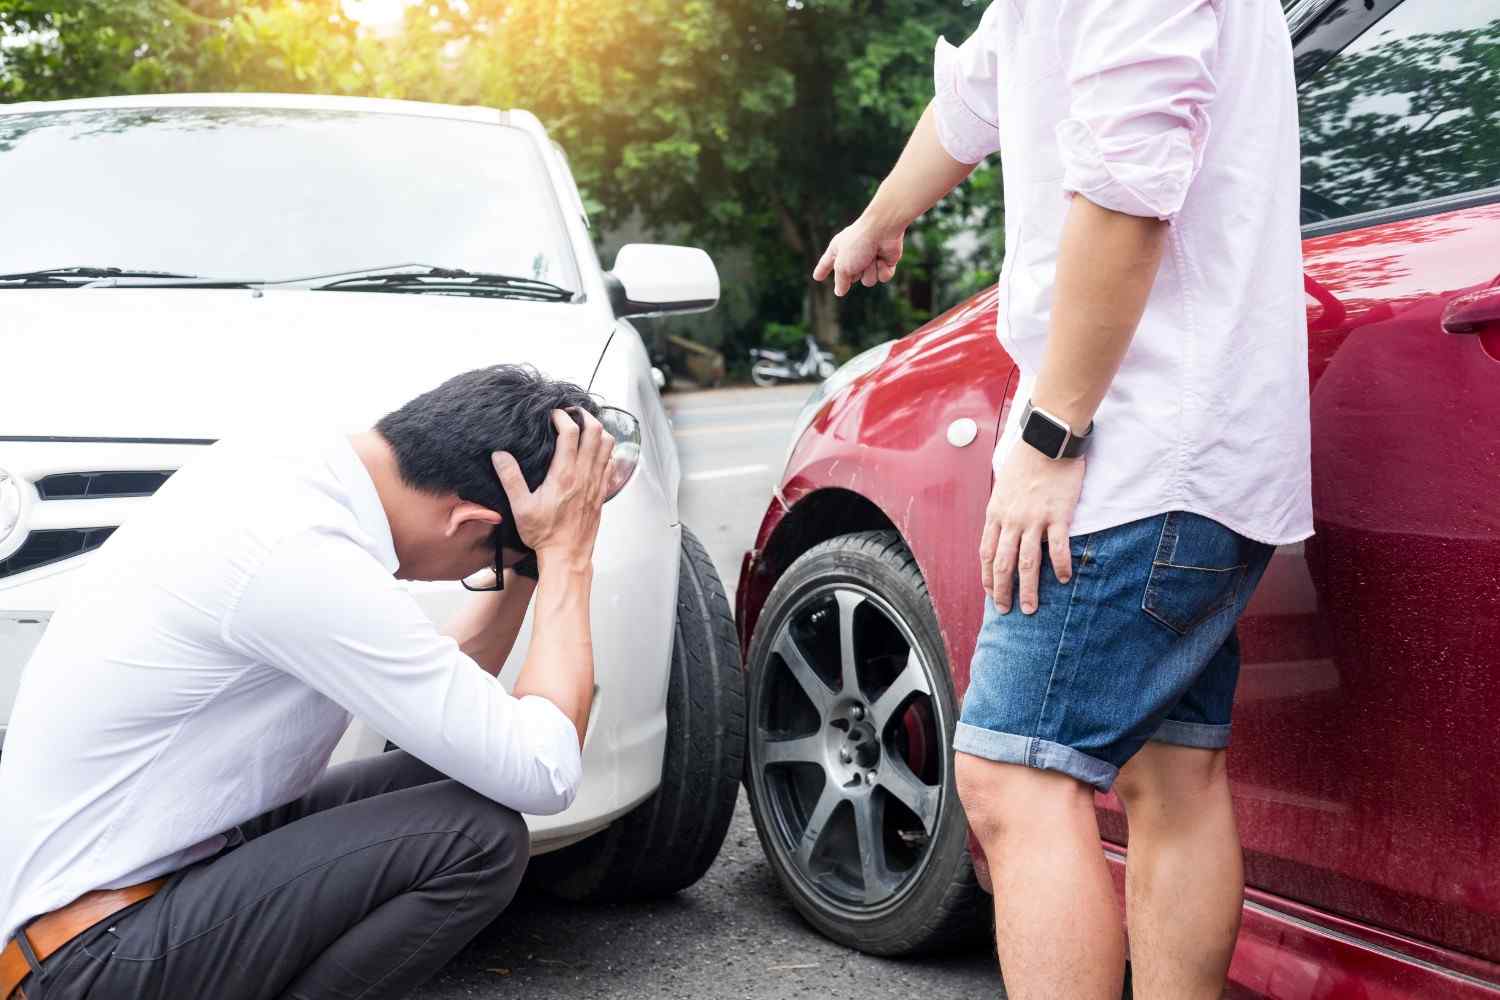
Every driver has experienced it—the sudden lane swerve, the red-light runner, the distracted driver staring at a phone instead of the road. While bad driving exists everywhere, it’s not evenly distributed across the United States.
Some states consistently rank worse than others for car accidents, traffic fatalities, DUI incidents, and insurance claims. These patterns matter, especially for injury victims, because states with the worst drivers tend to see more severe crashes and more complicated legal claims.
This guide examines which states have the worst drivers, why they rank poorly, and what these rankings mean after a car accident.
How Driving Risk Is Measured
There is no single definition of a “bad driver,” so safety researchers rely on multiple indicators to assess risk. Rankings typically consider a mix of crash data, behavioral trends, and insurance statistics.
Common metrics include:
- Traffic fatalities per capita
- Alcohol-impaired driving deaths
- Speeding-related crashes
- Rates of uninsured motorists
- Insurance claim frequency and severity
Federal agencies and insurance analysts use these indicators to identify states where driving is statistically more dangerous.
States With the Worst Drivers
While rankings shift slightly from year to year, certain states consistently appear near the bottom across multiple safety measures.
Texas: Speed, Scale, and Severe Crashes
Texas routinely ranks among the states with the worst drivers, largely because of its size and driving environment. The state has one of the highest traffic fatality totals nationwide.
Texas roadways include long rural highways with high speed limits, dense urban congestion in major cities, and heavy commercial truck traffic. High-speed crashes and multi-vehicle collisions are common, particularly outside metro areas.
For accident victims, Texas’s modified comparative negligence system can complicate claims, especially when insurers argue shared fault.
California: Congestion and Constant Distraction
California’s driving risks stem less from speed and more from density. With millions of drivers commuting daily, congestion-related crashes are common.
Urban areas experience frequent rear-end collisions, pedestrian accidents, and cyclist injuries. Distracted driving plays a major role, as stop-and-go traffic encourages phone use behind the wheel.
Despite lower average speeds, the sheer volume of traffic keeps California near the top for total accident and injury numbers.
Florida: Tourism, Uninsured Drivers, and Confusion
Florida consistently ranks as one of the most dangerous states for drivers. The combination of tourists, retirees, and year-round traffic creates unpredictable conditions.
Florida also has one of the highest percentages of uninsured drivers in the country. This increases financial risk after accidents and often leads to insurance disputes.
The state’s no-fault insurance system further complicates injury claims, limiting when victims can sue and increasing reliance on personal injury protection coverage.
Louisiana: High Fatalities Per Capita
Louisiana frequently ranks poorly for traffic deaths per capita, not just total crashes. While fewer people drive in smaller states, crashes are often more severe.
Impaired driving remains a major concern, along with lower seatbelt usage rates. Rural roads and aging infrastructure also contribute to higher fatality risks.
For injury victims, underinsured drivers are a common issue, increasing the likelihood of complex claims.
Arizona: Speed and Sprawling Road Design
Arizona’s wide roadways and urban sprawl encourage higher speeds, which significantly increase injury severity in crashes.
Speeding-related fatalities and motorcycle crashes are particularly common. Long commutes and open highways create conditions where a single mistake can result in catastrophic injuries.
Even with strong traffic enforcement, Arizona continues to rank poorly in national driving safety comparisons.
Nevada: Impaired Driving and Tourism Pressure
Nevada’s driving risks are closely tied to tourism, especially in Las Vegas. Heavy nightlife traffic, unfamiliar drivers, and alcohol consumption create dangerous conditions.
Late-night crashes, pedestrian accidents, and DUI-related incidents occur at higher rates than in many neighboring states. Rural highways outside urban areas also see high-speed collisions.
Key Risk Factors in States With the Worst Drivers
| State | Primary Risk Factors | Common Crash Types |
| Texas | Speeding, truck traffic | Highway, multi-vehicle |
| California | Congestion, distraction | Rear-end, pedestrian |
| Florida | Tourists, uninsured drivers | Intersection crashes |
| Louisiana | Impaired driving | High-severity crashes |
| Arizona | Speeding | Motorcycle, highway |
| Nevada | DUI, nightlife traffic | Late-night, pedestrian |
Why These States Produce More Dangerous Driving Conditions
Poor driving outcomes are rarely caused by individual behavior alone. Structural and environmental factors play a major role.
Many high-risk states share:
- Rapid population growth or heavy tourism
- Long commute distances
- High-speed road design
- Limited public transportation options
When these conditions overlap, accident rates rise even with strong enforcement.
Insurance Costs Reflect Driving Risk
Insurance companies price risk based on driving behavior and claim history. States with worse driving records often see higher premiums.
Key factors insurers consider include:
- Frequency of accident claims
- Average injury severity
- Medical and repair costs
- Fraud risk
Drivers in high-risk states typically pay more for coverage, and injury victims often face more aggressive insurance tactics.
What This Means After a Car Accident
Being injured in a state with a high accident rate changes the claim landscape.
In these states, victims are more likely to face:
- Disputed liability claims
- Arguments over shared fault
- Uninsured or underinsured drivers
- Delayed or reduced settlement offers
Understanding local driving risks and laws becomes especially important after a crash.
Are “Worst Driver” Rankings Always Accurate?
 Large states naturally report more accidents simply because more people drive there. That’s why per-capita statistics and behavior-based data are critical for fair comparisons.
A smaller state can rank poorly if crashes are more severe or if risky behaviors—such as impaired driving—are more common.
These rankings are about identifying risk patterns, not assigning blame.
Why This Topic Matters for Injury Victims
Understanding where driving risk is highest helps:
- Drivers stay alert in high-risk environments
- Injury victims anticipate insurance challenges
- Lawyers evaluate claim complexity
Location plays a larger role in accident outcomes than most people realize.
Where Driving Is Riskiest and Why
- Some states consistently report higher crash and fatality rates
- Structural factors amplify driving risk
- Insurance costs reflect accident frequency
- Injury claims are often harder in high-risk states
Knowing where driving is most dangerous helps drivers make safer choices and helps injury victims take informed next steps.